
Every March, college basketball fans lean on everything from player performance and season records to coin flips, alma mater loyalty, and even viral mascot matchups to try and outsmart the chaos of college basketball bracket season.
Here at LightBox, we wanted to try something else entirely. What if the winners were chosen not by stats or seeding, but by city, county, and metro-level data?
Before we go there, a quick nod to the athletes. The 16 programs still standing have earned it. Survive and advance is the name of the game, and each of these teams has done just that.
With the field narrowed, we explored what a market-driven lens might reveal about how things could unfold.
From the Court to the Data
We took the cities represented in the remaining field and ran them through six LightBox data signals, each reflecting a different dimension of commercial real estate activity and historical depth:
- Changes in lender-driven appraisal activity (a proxy for financing and transaction momentum)
- Shifts in demand for Phase I Environmental Site Assessments (ESAs) (an early indicator of deal flow)
- Changes in commercial properties being brought to market (broker activity and market supply)
- Historical city directories (depth of historical records and urban continuity)
- Sanborn maps (richness of historical property-level data)
- Starbucks locations (a proxy for retail density and consumer demand)
The result? A composite, data-driven score for each market, giving us a way to predict which cities (and therefore which teams) might advance if LightBox data were the deciding factor.
A Tale of Two Extremes: Urban Gateways vs. College Towns
The cities and towns represented in this round span the full spectrum of the U.S. economic landscape. On one end are primary markets, dense, global gateway markets like New York City and Houston. These cities tend to dominate across multiple data categories:
- Growth in appraisal demand from lenders
- Strong Phase I ESA growth
- Deep broker listing pipelines
On the other end are college-driven markets, where the university is the central economic engine. These areas may not match the scale of major metros, but they can be associated with strong localized activity and surprisingly deep historical data footprints. In between are fast-growing secondary markets with strong demographic and economic momentum. These 16 cities offer a compelling cross-section of the U.S. CRE landscape.
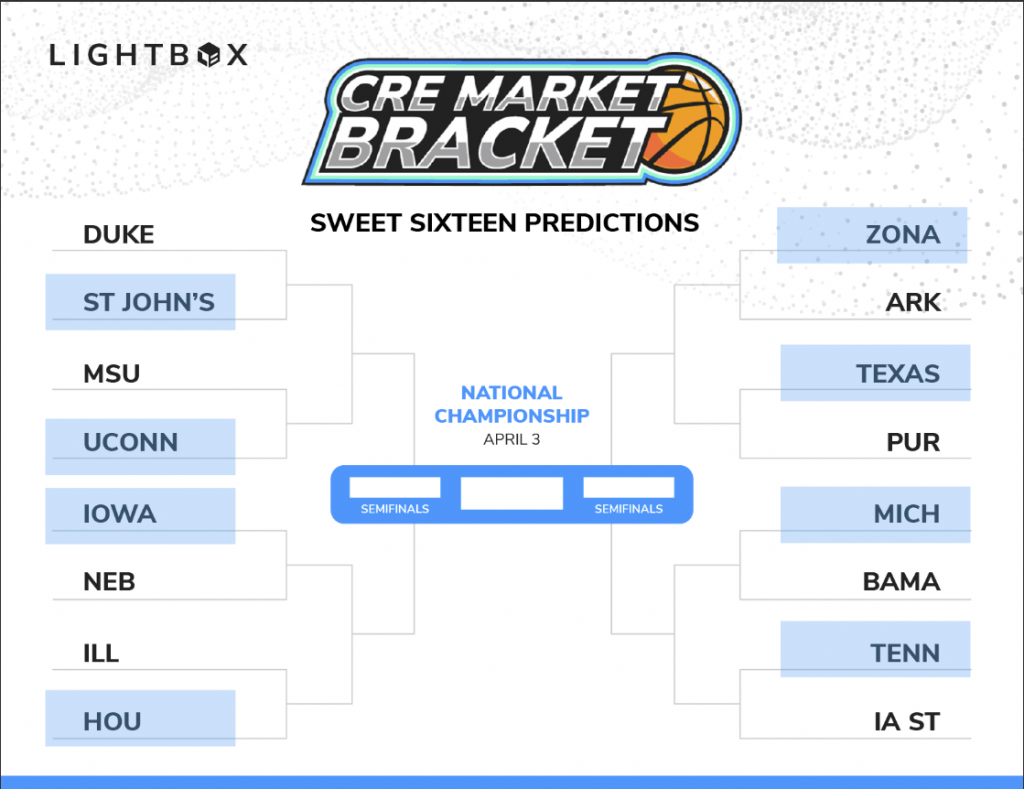
Case Study: Duke vs. St. John’s
Let’s look at one matchup: Duke (Durham, NC) vs. St. John’s (Queens, NY). This is a classic contrast. Durham is a fast-growing, research-driven metro anchored by the Triangle. Queens, by contrast, sits within New York City, one of the largest and most dynamic CRE markets in the world. When we ran the data, a few things stood out:
New York showed strong momentum in forward-looking indicators, with annual Phase I ESA activity and early Q1 appraisal activity both up 34%, a clear sign of active deal pipelines and financing activity. Its scale and density also drove higher scores in listings and overall market breadth. Durham, however, had its own edge: it outperformed in historical city directory data, reflecting a well-documented and deeply rooted footprint in LightBox’s datasets. But when all six metrics were combined? St. John’s (Queens/NYC) came out ahead.
Predicting the Next Round (With a Grain of Salt)
Using these data points, we took a shot at predicting which teams might advance. Will LightBox data get it right?
Maybe. Maybe not. Because this is bracket season madness.
The same unpredictability that defines the tournament (the last-second shots, Cinderella runs, breakout performances) also has clear parallels in markets. Variables like sudden shifts in market sentiment, new capital flows, changing supply-demand dynamics, and population and migration trends can all impact the end result.
And just like in basketball, past performance doesn’t guarantee future results. As anyone filling out a bracket knows, you can analyze trends, model outcomes, and study strengths and weaknesses, but there’s always an element of surprise.
So here we are: 16 teams, 16 markets, and one data-driven bracket.
We’ve taken our best shot using LightBox data, but the real outcome will, of course, play out on the court. We’ll know soon enough how the predictions hold up.
Have a market you’re watching? Reach out to insights@lightboxre.com and we’ll run your metro through these same data signals.
The CRE Market Bracket and associated predictions are for entertainment purposes only. They are based on historical data and internal analytics and do not constitute investment advice or assurances of future market performance.