The third quarter of 2024 was the third consecutive quarter of increases in Phase I environmental site assessment (ESA) activity, with a modest 2% increase over the prior quarter, according to output from the LightBox ScoreKeeper model. Compared to one year ago, total U.S. Phase I ESA activity in Q3 was up a slightly more robust 5%.
The most notable development of the quarter was the Federal Reserve’s first interest rate cut in 4½ years—and a bold 50-basispoint cut at that. While it will take time—and more rate cuts—for any meaningful impact on Phase I ESA demand that supports lending and dealmaking activity, the September cut was an important first step, fueling a cautiously optimistic sentiment heading into Q4. Another notable Q3 event was late September’s Hurricane Helene in the southeastern U.S. (followed closely by Hurricane Milton in early October), bringing into stark relief the ongoing challenges of extreme climate-related weather events and skyrocketing property insurance costs.
For any environmental consultants struggling to forecast their Phase I ESA business or benchmark your own Q3 2024 activity against industry benchmarks, here are a few highlights from the Q3 CRE Snapshot report:
- U.S. Phase I ESA volume increased a modest 2% in Q3 over the prior quarter, with year-to date volume level with 2023.
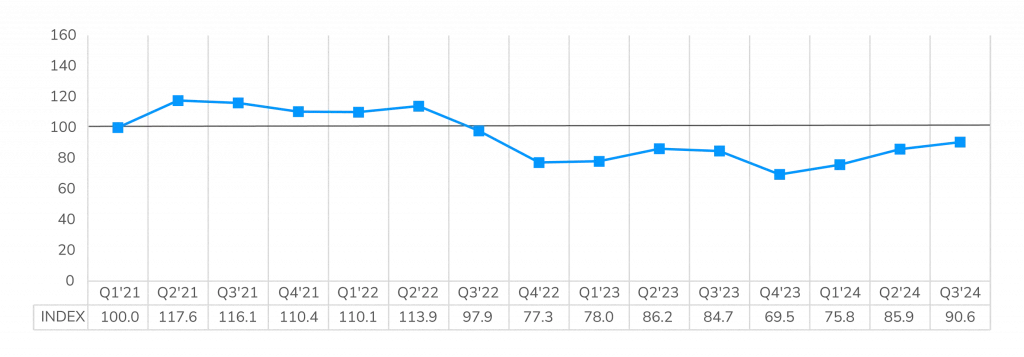
- The LightBox Phase I ESA Activity Index increased for the third consecutive quarter in Q3 to 90.6, a two-year high point and an increase of 5.8 points compared to one year ago.
- The three primary metros that outperformed the modest 2% industry growth benchmark were all in the Sunbelt region: Atlanta (13%), Dallas (12%), and Miami (11%).
- At its September meeting, the Federal Reserve lowered interest rates for the first time since pre- COVID with a 50-basis point cut.
- Members of the LightBox Market Advisory Council report increased demand for Phase I ESAs even in advance of the rate cut as clients tee up new projects and refinance activity begins to ramp up.
Lightbox Phase I ESA Index Jumps 5.8 Points to Highest Point in Two Years
The LightBox Phase I ESA Activity Index rose 5.8 points year over year to 90.6, its highest level in two years, as the momentum that started to build at the end of Q1 continued to gain steam, especially in anticipation of the first interest rate cut. As clients begin to wade back into investment and lending, it’s driving modest increases in Phase I ESA demand. Year over year, the Index is 5.8 points above where it was at this time last year when transactions were challenged by low property listings and widespread price uncertainty. As rates continue to come down, lenders are likely to slowly reinvigorate loan originations and compete with non-bank lenders that have grabbed market share as transactions tick back up (either as traditional transactions or forced sales of distressed assets).
LightBox Phase I ESA Activity Index (base Q1 2021=100)

Near-Term Outlook: 58% of Market Leaders Expect Higher Q4 Phase I ESA Volume
The first interest rate cut had a noticeable impact on overall CRE market sentiment with the latest round of surveys conducted by organizations like NAIOP, CREFC, and SIOR all pointing to renewed optimism. September’s strong transactions volume is continuing through October, so it’s not surprising that a significant 58% of CRE Market Advisory Council members expect to see higher Phase I ESA demand in Q4 compared to Q3, driven by capital market tailwinds boosting stronger CRE and M&A transactions. Another 42% expect stable volume, and notably, no member is expecting a decline.
“Our proposal volume for environmental due diligence services ticked up noticeably in Q3, but the conversion rate to projects has not followed suit. This is encouraging and suggests clients are waiting for the election or another rate drop before pulling the trigger, but they seem poised to pull it.”
– Adam Meurer, Senior VP, Director of Environmental Services, ECS Mid-Atlantic, LLC
Expectations for Phase I ESA Demand in Q4 2024

The first rate cut was a small but important step away from the days of high debt capital costs challenging transactions and property values, but there is typically a market lag with respect to interest rate shifts so it will take time for meaningful improvement to take root. Increased insurance costs and the upcoming election may also keep investors on the sidelines until there is more clarity on the policy environment under the new administration.
Recovery will also not be uniform and will vary by client type, geographic region, and market sector. Phase I ESA professionals can take solace in the fact that market is more optimistic than it has been in years and that Q3 set the stage for the pool of investors to expand with stronger transaction and lending velocity to follow along with greater access to capital as the widespread transfer of CRE assets and property redevelopment continues in this post-COVID chapter.
The LightBox CRE Market Snapshot Series, Q3 2024 – Focus on Phase I ESA Trends contains more detailed information and metrics on trends in Phase I ESA volume by year, quarter region, metro and for the LightBox25 Index.
For more information about this report series or the data, email Insights@lightboxRE.com
