
Commercial real estate deal flow increased in June, with LightBox tracking 49 nine-figure ($100M+) transactions, a modest bump from May which had 45 deals. The mid-cap ($50-$100M) activity surged significantly with 58 deals, up from just 37 in May. This pickup in both nine-figure and midcap trades suggests investors are finding more pricing clarity and renewed confidence, even as the macroeconomic environment continues to produce uncertainty.
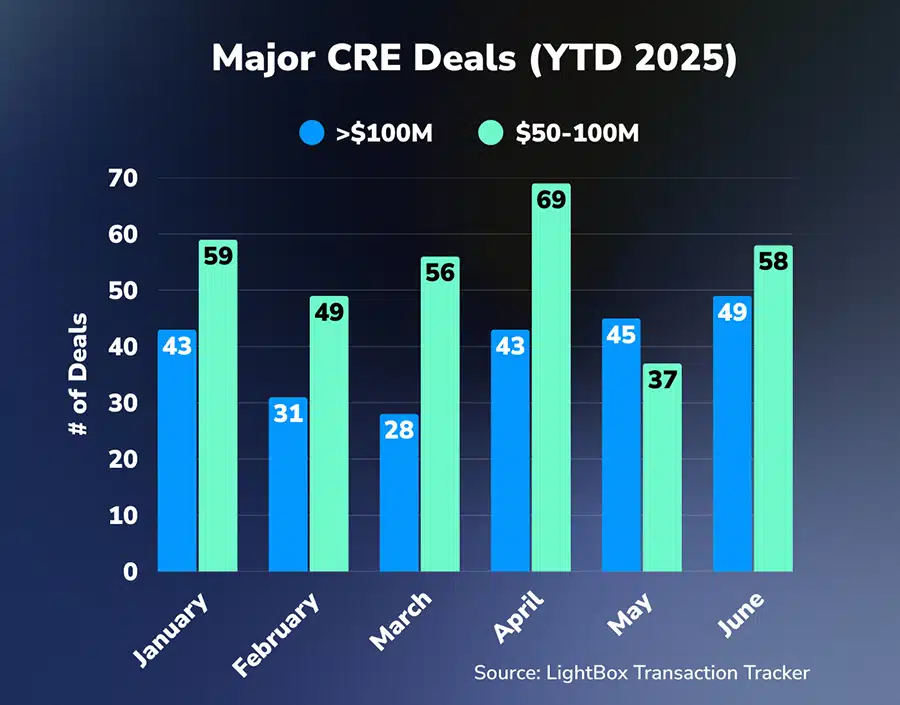
This jump in transaction velocity mirrors a broader trend captured in the June LightBox CRE Activity Index, which surged to 113.9, its highest reading since May 2022. The Index’s 8% monthly gain reflects an active pipeline across environmental due diligence, property listings, and commercial appraisals. “We’re seeing buyers re-engage where underwriting has adjusted and expectations have come back to earth,” said Manus Clancy, head of Data Strategy at LightBox.
As we move into the second half of 2025, early deal indicators point to a market that’s pushing forward despite tariff-led volatility, sentiment headwinds, and economic uncertainty. The following sector breakdown explores what June’s top transactions reveal about pricing discipline, metro-level activity, and capital strategy across multifamily, office, industrial, and retail assets.
Mid-Cap Momentum Returns, Led by Multifamily and Industrial
June’s deal volume revealed a clear shift toward mid-cap investment with a 57% increase from May and continued strength in nine-figure activity with a near-9% uptick. This mid-cap rebound was felt across nearly every major property type, with industrial and multifamily leading the way at 17 and 15 deals respectively. That marks a meaningful increase from May, when those sectors recorded 11 and 14 mid-cap trades, respectively.
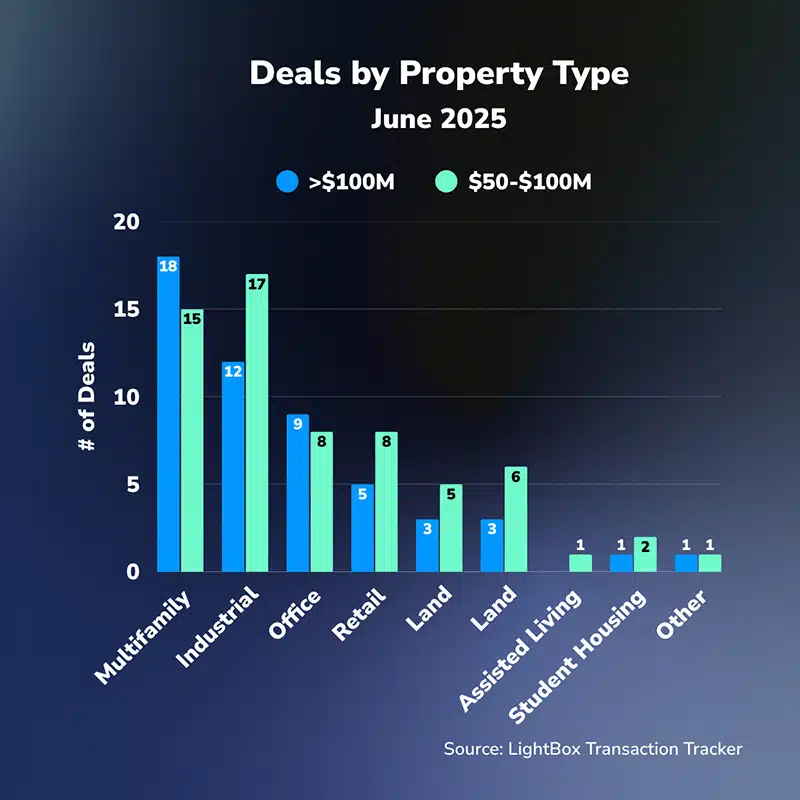
At the top end, multifamily remained the most active asset class with 18 nine-figure deals, followed by industrial and office with 12 and 9 deals respectively. While deal flow varied across property types, overall nine-figure volume edged higher from May. That strength at the top of the market was accompanied by a clear rotation into smaller but more plentiful transactions, particularly in markets where valuations have adjusted and debt is more accessible.
Student housing and senior living also returned to the table, after being absent in May, and their reappearance may reflect rising investor appetite for long-term demographic plays. Meanwhile, hotel assets dropped off entirely. After posting four deals in May, the sector was silent in June.
“The profile of deal activity right now shows that investors are moving down the stack where pricing feels more defensible and financing is less constrained. That’s where we’re seeing the sharpest growth,” Clancy noted.
Multifamily Stays on Top as Buyers Compete for Fewer Listings
Multifamily was once again the most active sector in June, with 18 nine-figure transactions and another 15 in the $50–$100 million range. It has now led all asset classes in high-value volume for four consecutive months.
Investor interest remains strong, but the field is increasingly competitive. According to Colliers’ June 3 report, multifamily has posted 11 straight months of year-over-year sales gains. Buyers are circling, but limited listings continue to constrain activity. “It’s a market where it feels as though everyone is a buyer while few are willing to sell,” the report noted.
Renters, meanwhile, are staying put. The report noted “in nearly every market, renting remains more affordable than buying.” With mortgage rates in the 6 to 7% range and home prices near all-time highs, homeownership remains out of reach for many. That affordability gap is helping prop up occupancy, while slower starts and tighter capital for ground-up development are keeping new supply in check.
“The imbalance between pent-up demand and limited for-sale inventory is giving sellers leverage again,” said Clancy. “And because multifamily rents are stabilizing in many metros, the underwriting floor feels more defensible now than it did six months ago.”
Notable Multifamily June Transactions
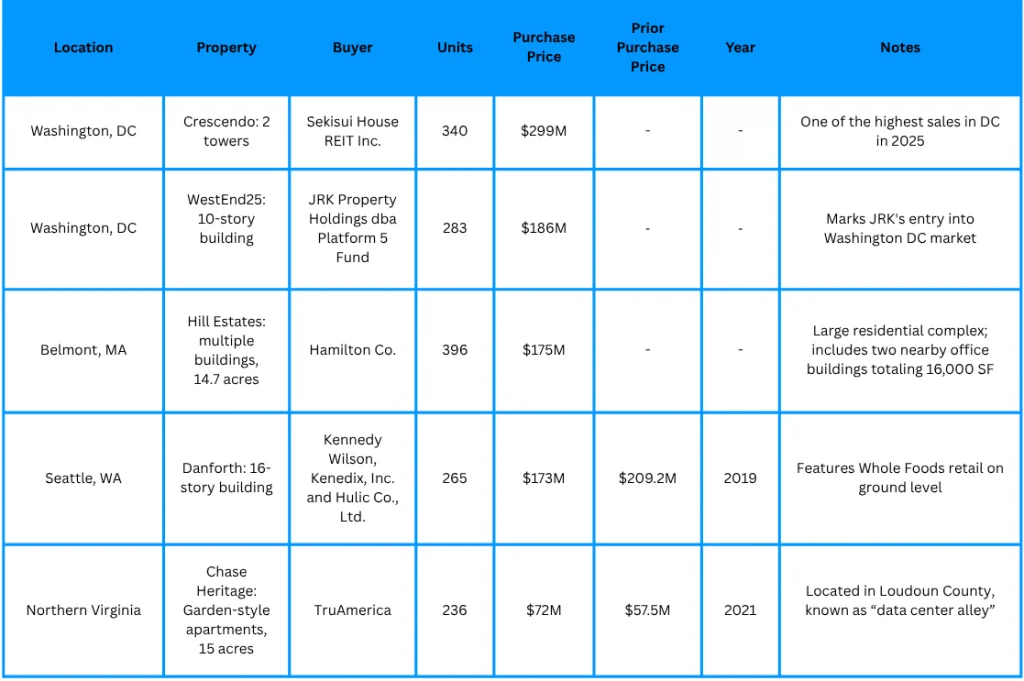
And there’s a new wrinkle. Inside the Big Beautiful Bill is a new tax law that is a major shift for affordable housing: a revamped Low-Income Housing Tax Credit that could unlock 1.2 million new units by 2035. Developers now only need 25% bond financing, down from 50%, reviving stalled deals. Moreover, the permanency of Opportunity Zones add fuel to this multifamily momentum that may be getting an even bigger kick.
The student housing segment also made its presence felt in June. A 2,000-bed property in Oxford, Mississippi traded for $262 million, a sign that large-scale student housing deals are back in play. Student housing rent growth reached 4.9% year-over-year in June, pointing to continued investor appetite, according to Yardi Matrix.
Office: A Flurry of Early Deals, but Pricing Pressure Mounts
The office sector was unusually active in early June, with five large transactions closing within the first week. But that early momentum came with a clear caveat: buyers are demanding (and getting) deep discounts. The nine-figure deal count fell to 9 from 16 in May, while mid-cap trades rose modestly from five to eight.
Nationally, the availability rate for U.S. office space fell to 23.2% in Q2, according to Avison Young, marking the fourth straight quarterly improvement, a trend not seen since before 2016. Transaction activity has picked up. U.S. office investment sales reached $14.9 billion in the first half of 2025, a 36% increase over the same period last year, and $40.8 billion has traded over the past four quarters, up 69% year-over-year.
Yet the pricing required to move those deals tells the broader story. Multiple June transactions traded at deep discounts to previous valuations, particularly in challenged markets like San Francisco, San Mateo, and Northern Virginia.
Notable Office June Transactions
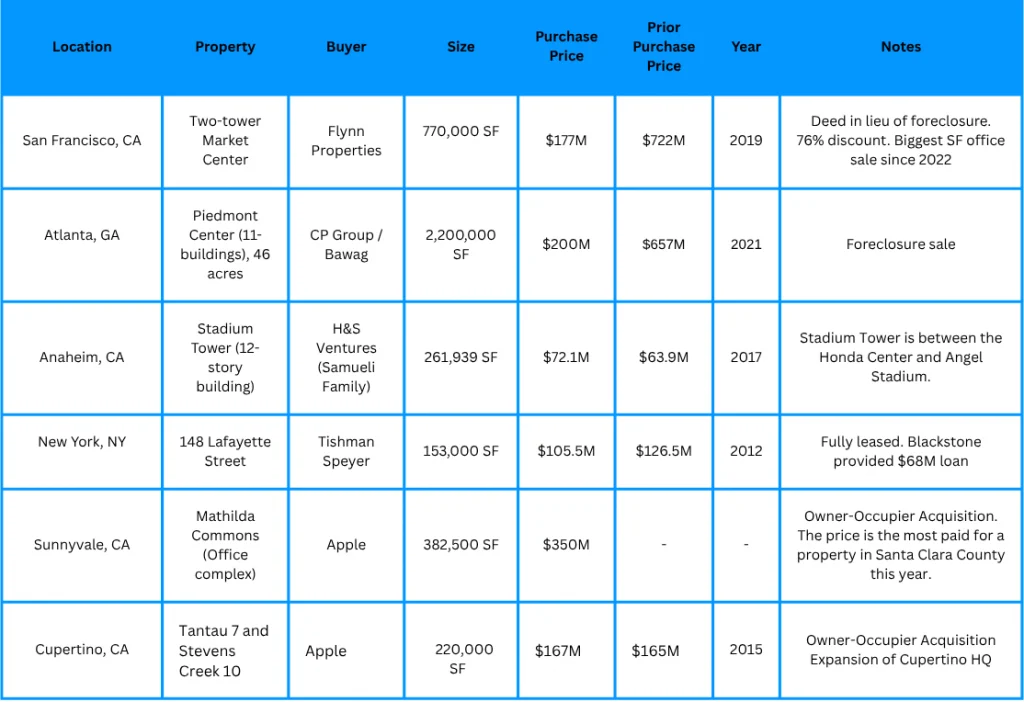
“Office values continue to be highly situational,” noted Clancy. “Distress is driving activity in some cases, while in others, buyers with long-term strategy or owner-occupier needs are stepping in where pricing aligns with today’s realities.”
Assemblages Picking Up Steam in Key Markets
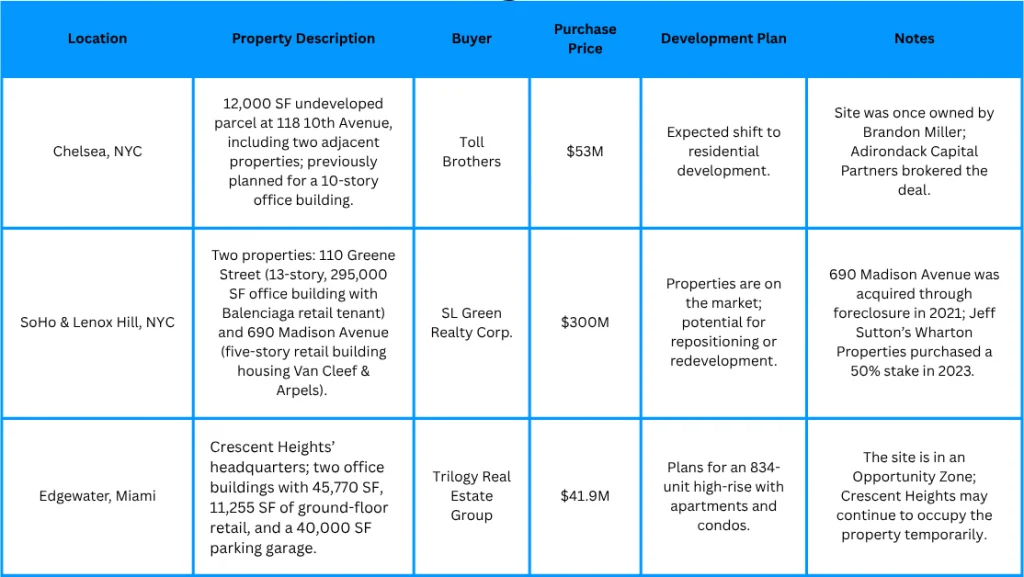
Assemblage deals are strategic acquisitions of adjacent parcels to create larger, more valuable development sites and they are gaining momentum in key urban markets. These transactions often signal long-term confidence in neighborhood growth and zoning potential. June saw three major CRE assemblages, highlighting their strategic importance and development implications.
“Assemblages are a strategic focus in prime urban locations with potential for significant redevelopment. Developers are capitalizing on opportunities to transform underutilized properties into high-density residential or mixed-use projects, reflecting confidence in the long-term growth of these neighborhoods,” Clancy said.
Notable Assemblage June Transactions
Retail Regains Momentum with June’s Largest CRE Deal
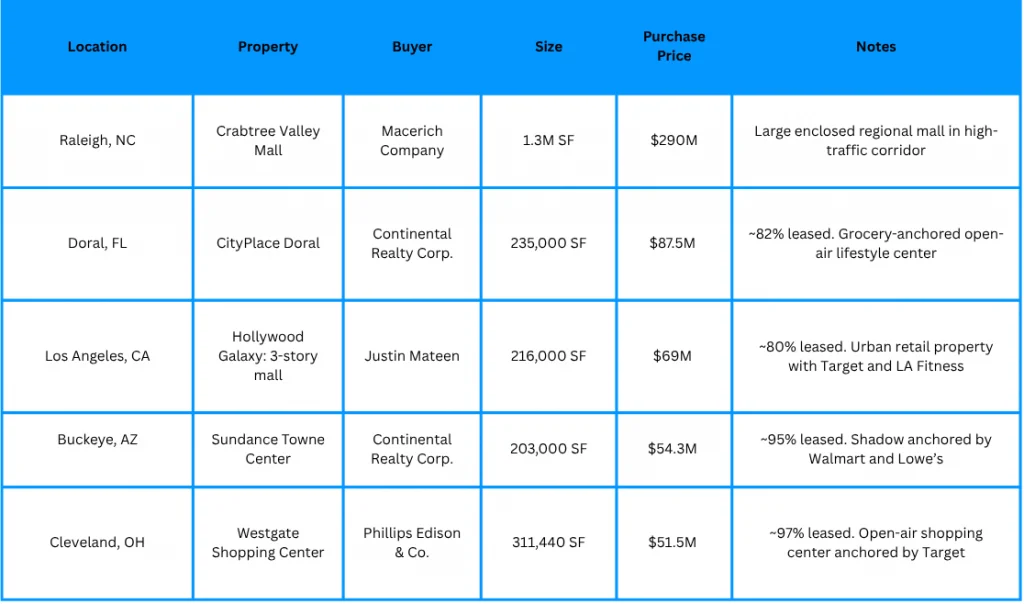
Retail investment picked up in June 2025, with nine-figure and mid-cap transactions rising from two apiece in May to five and eight respectively. The activity continued to concentrate in open-air, grocery-anchored centers and assets in high-growth Sunbelt markets. Despite broader economic uncertainties, the sector is benefiting from limited new supply, strong consumer demand, and the enduring appeal of neighborhood retail formats.
Capping off the month, the retail segment also recorded the largest commercial real estate transaction of June: the $1.57 billion sale of 270 GetGo convenience and fueling locations from Giant Eagle to Alimentation Couche-Tard. The portfolio spans Pennsylvania, Ohio, West Virginia, Maryland, and Indiana, and includes a variety of formats, from open-concept stores to standalone kiosks, offering made-to-order food and fuel services.
Notable Retail June Transactions
Momentum Is Building, but Selectivity Still Rules
The market’s most active investors are pricing risk in real time, focusing on sectors where fundamentals are stabilizing and capital structures have become more transparent.
“CRE capital for large transactions is flowing at a steady clip, but with conditions,” Clancy said. “Valuation assumptions are tighter. Financing windows are narrower. And underwriting demands a level of clarity that only disciplined buyers and well-positioned sellers can meet. This is not a wave lifted by sentiment. It’s a cycle built on fundamentals, data, and speed-to-adjust.”
Heading into the third quarter, deal volume may soften modestly in July and August as summer seasonality slows transaction timelines, but investor appetite remains strong, particularly in the $50–$100 million range. Mid-cap trades are likely to stay active where pricing has recalibrated. Nine-figure sales will hinge on asset type, location, and the availability of debt, with distress, owner-occupancy, and redevelopment opportunities continuing to drive activity.
We’ll be tracking the signals. To get this analysis every month, complete with exclusive data and commentary, subscribe to Insights and get the next edition delivered directly to your inbox.