LightBox data for Q3 shows a CRE market balancing continued momentum against persistent macroeconomic uncertainty. Property listings in LightBox platforms dipped slightly from Q2 highs but stayed 7% above Q1, underscoring steady market activity rather than a pullback.
The latest LightBox Q3 2025 Property Listings Index report reveals:
- Why a quarterly dip in the Index still points to underlying momentum in the CRE market.
- Which property types gained ground and what their performance says about shifting investor priorities.
- What’s behind the surge in CRE investment that made Q3 one of the strongest quarters since 2019.
Q3 Movement in Lightbox Commercial Property Listings Index
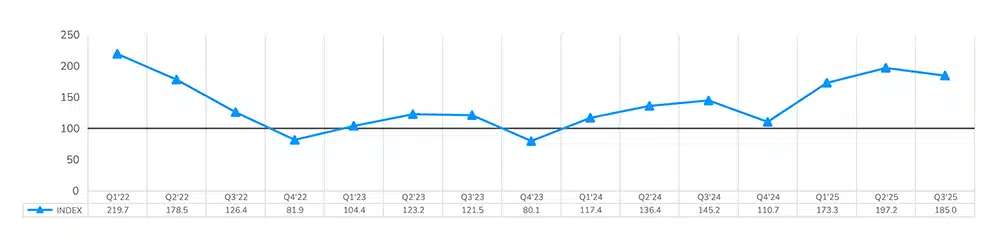
The LightBox Property Listings Index edged down 6% in Q3, from 197.2 to 185.0, reflecting typical seasonality rather than weakening momentum. July and August listings fell 2% and 12%, following June’s exceptionally strong pace, consistent with a midsummer lull, before surging 25% in September to the highest monthly level of 2025. The late quarter rebound highlights renewed seller engagement and steady buyer interest amid improving price discovery. While the upswing didn’t lift the quarterly index above Q2’s peak, September’s strength confirms solid seller momentum across the 2025 market, largely attributable to firmer price stabilization across asset classes than in 2024.
LightBox Commercial Property Listings Index (base Q1 2021=100)