
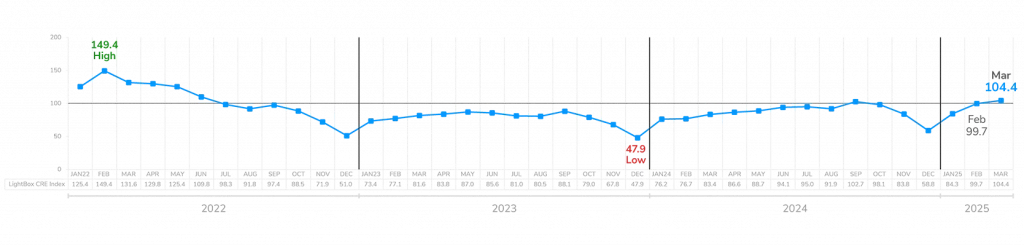
Amid heightened capital market volatility and mounting concerns over the economic impact of evolving tariff policies, the LightBox CRE Activity Index defied broader market sentiment, rising to 104.4 in March—its highest level since June 2022 and only the second triple-digit reading during that nearly three-year span. The sustained momentum reflects increased seller willingness to bring commercial assets to market and renewed engagement by lenders as investor interest picks up.
While fears of an investment slowdown weighed heavily on equities and triggered wild swings in the 10-year Treasury throughout the month, the CRE Activity Index offers early evidence that momentum continues to gain traction despite the macroeconomic headwinds. If investors view commercial real estate as a safe harbor in an otherwise volatile market as the just announced tariffs take effect, the Index could continue to climb in April—but if conditions shift, a decline in the Index would serve as an early signal of softening activity.
March Index Breaks into Triple Digits for First Time Since September
March’s reading of 104.4 was a 4.7% increase from February and a 25.2% surge compared to the same time last year. This was the third consecutive month of growth after a characteristically slow December—and a strong sign of a stabilizing CRE market that may be decoupling from broader market volatility. Based on nearly 28,000 data points from property listings, environmental site assessments, and appraisal orders, the Index is one of the earliest and broadest indicators of CRE market activity.
Commercial Property Listings:
Commercial property listings on LightBox platforms surged in March, up 56% year-over-year and 6% higher than February. This was the highest volume since the June 2022 market peak.
Environmental Due Diligence:
The 12% month-over-month jump in Phase I ESAs in March signals growing demand for due diligence as the dramatic rise in listings fuels loan activity and deal flow.
Commercial Appraisals:
Lender demand for commercial appraisals rose 5% in March month-over-month, extending Q1’s steady climb as maturities and borrower demand drove appraisals in the lender sector.
Monthly LightBox CRE Activity Index (January 2021 – Present)

Manus Clancy
Head of Data Strategy
LightBox
“While volatility rattled other parts of the market, March’s index highlights the commercial real estate sector’s resilience. Rising listings and consistent lender activity show that investors found opportunities, even in this uncertain economic environment.”
Is CRE the Safe Haven in an Increasingly Volatile Capital Market?
While March’s three-digit CRE Activity Index signaled strong transactional momentum, the near-term outlook remains clouded by growing policy and economic uncertainty. The rapid pace of developments on the trade, inflation, and labor fronts is expected to sustain elevated volatility in the coming months, despite CRE’s potential positioning as a relative safe haven for investors.
Whether this momentum persists will depend on how key macro indicators unfold. Further erosion in sentiment—or weakening in metrics such as PCE, labor market data, or GDP—could dampen investor confidence, stall transaction volume, and prompt delays in leasing or development activity as stakeholders adopt a wait-and-see approach.
At the same time, mounting economic headwinds may increase pressure on the Federal Reserve to begin lowering interest rates. If that materializes, it could serve as a tailwind for CRE investment. The near-term outlook hinges on a wide range of scenarios, and with so many variables in play, the forecast is challenging. As an early indicator of CRE momentum, the April CRE Activity Index will offer important insight into how investors and lenders are responding to an extremely dynamic and unprecedented market environment.
About the Monthly LightBox CRE Activity Index
The LightBox Monthly CRE Activity Index is an aggregate that represents a composite measure of movements across activity in appraisals, environmental due diligence, and commercial property listings as a barometer of broad industry shifts in response to changes in market conditions. To receive LightBox reports, subscribe to Insights.
Subscribe To Insights

Be the first to get the latest news, updates and insights from LightBox.