LightBox tracked nearly $27 billion in total CRE transactions in September, marking the busiest month of 2025. At the high end of the spectrum, nine-digit deals above $100 million rose 23% month over month, running 34% above the year’s monthly average. Mid-cap transactions between $50 million and $100 million rebounded 18% from August’s dip and surpassed July levels to set a new high point for the year.
Major Commercial Real Estate Deals (YTD 2025)

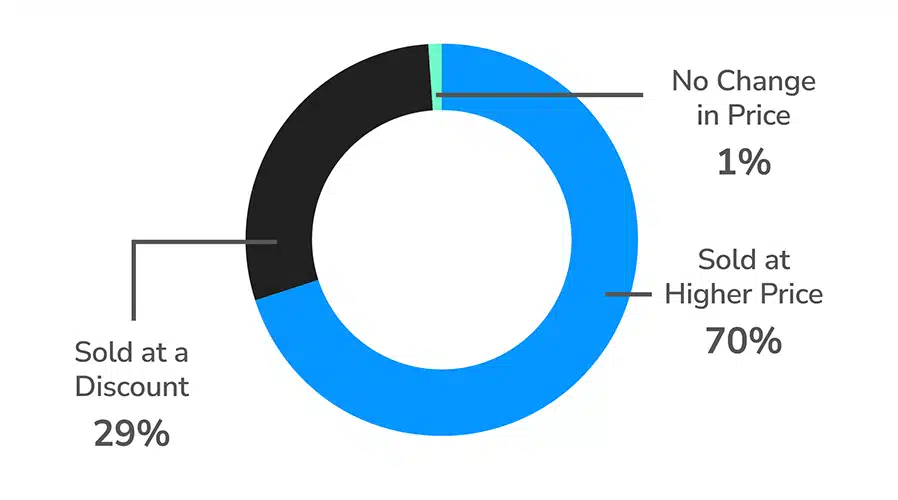
Most properties are changing hands at higher prices than their previous sales, though discounts remain steep for struggling assets. Strong deal activity through the summer months defied any seasonal slowdown, and September’s surge positions the market for a robust Q4, especially if additional rate cuts materialize.
“September marked a real inflection point for deal activity. The data shows capital coming off the sidelines and reengaging across asset types. It’s less about a sudden rally and more about the market finding its footing again after an extended period of hesitation.”
– Manus Clancy, Head of Data Strategy, LightBox
A Split Market Shows Strength and Stress Side by Side
LightBox’s Transaction Tracker logged 970 U.S. closings in September, from a $200K Ohio retail sale to a $1.6B multi-state portfolio. Among the 20% of trades with prior purchase history, 70% changed hands at sales prices above prior sale while 29% sold at a discount.
September CRE Deals
(with known prior purchase price. 20% of total deals)

This is just a snapshot of the trends shaping CRE deal flow. The full September Transaction Tracker Report includes sector-level details, top 10 buyer rankings, and forward-looking analysis from our data team.