
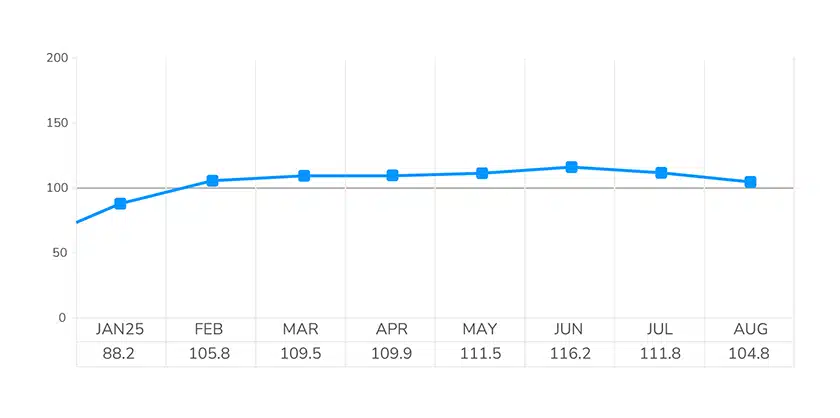
The LightBox CRE Activity Index slipped to 104.8 in August, down from July’s 111.8 and June’s multi-year high of 116.2. While part of the decline reflects the typical late-summer slowdown, the dip also signals rising caution as market participants digest a mix of economic signals on inflation, jobs, corporate earnings, and consumer spending. Even so, the Index has now registered seven consecutive months above the 100-point benchmark for healthy CRE activity.
The Index aggregates daily activity across three core CRE functions, environmental due diligence, commercial property listings, and lender-driven appraisals, drawing from more than 30,000 data points supporting lending and investment decisions.
Three Signals from August’s CRE Activity Index
The CRE Activity Index is based on the average daily volume over the past month in each of the three functions that support CRE lending and investment:
- Commercial property listings dropped 12% month over month following a similar decline in July after strong gains in June, reflecting a pause in momentum after steady growth earlier this year.
- Pre-transaction and lending environmental due diligence, measured by the volume of Phase I ESA activity, continued its steady streak for the third straight month.
- Lender-driven commercial appraisal volume fell a modest 3% in August, as rate uncertainty and tariff concerns weighed on underwriting.
Monthly LightBox CRE Activity Index (YTD 2025)
“August’s dip is in part due to the usual summer lull, but perhaps also a reflection of growing market caution. With job data showing softening, corporate earnings pointing to stress, and tariff uncertainty clouding forecasts, the pullback is understandable.”
– Manus Clancy, Head of Data Strategy, LightBox.
Near-Term Outlook: A Critical Test for CRE Momentum
The next few months will be critical for gauging whether CRE can sustain the momentum we’ve seen thus far in 2025. Historically, September marks a rebound as capital re-engages post-summer, and this year, that bounce may be amplified if the Fed delivers its widely-expected first rate cut of the year.
September’s reading will be telling. A rebound would confirm that August was just a seasonal blip, while another soft result could signal that CRE momentum is starting to stall. The LightBox Transaction Tracker offers some reassurance: July dealmaking set a new high water mark for deals above $50 million, and preliminary August data show that deals are still running 12% above the 2025 monthly average. Even through the summer, developers continued to push forward on major, capital-intensive projects with financing already secured, and capital availability from banks, life companies, and the GSEs remains intact, even as underwriting stays conservative.
Still, many moving pieces shape the CRE outlook, from tariff uncertainty and a weakening labor market to questions around the Fed’s next steps. If a September rate cut materializes, it could help support deal flow and lending activity into Q4. For now, the CRE Activity Index underscores that investors are still closing deals and capital is available, but that decision-making is increasingly cautious. For now, transaction activity looks positioned to finish 2025 on steady footing, without the excesses of past cycles but also without clear visibility. The foundation for 2026 is being laid, but it rests on a decidedly unsettled economic backdrop.
ABOUT THE MONTHLY LIGHTBOX CRE ACTIVITY INDEX
The LightBox Monthly CRE Activity Index is an aggregate that represents a composite measure of movements across activity in appraisals, environmental due diligence, and commercial property listings as a barometer of broad industry shifts in response to changes in market conditions. To receive LightBox reports, subscribe to Insights.