
After a strong start to Q4, Phase I ESA activity moderated as the quarter progressed, both due to a typical Q3-to-Q4 seasonal slowdown as well as the growing policy and geopolitical uncertainty. By year-end, Phase I ESA activity declined by 15% below Q3 levels, but was still 9% above Q4 of 2023, according to output from the LightBox ScoreKeeper model.
In addition to market uncertainty, the second half of 2024 was also a period of technical adjustment. Environmental consultants are navigating the complexities of addressing PFAS risk within the scope of CERCLA-driven Phase I ESAs in response to the U.S. Environmental Protection Agency’s designation of two types of PFAS as hazardous substances last April.
Key Developments from the Q4 2024 CRE Snapshot Report:
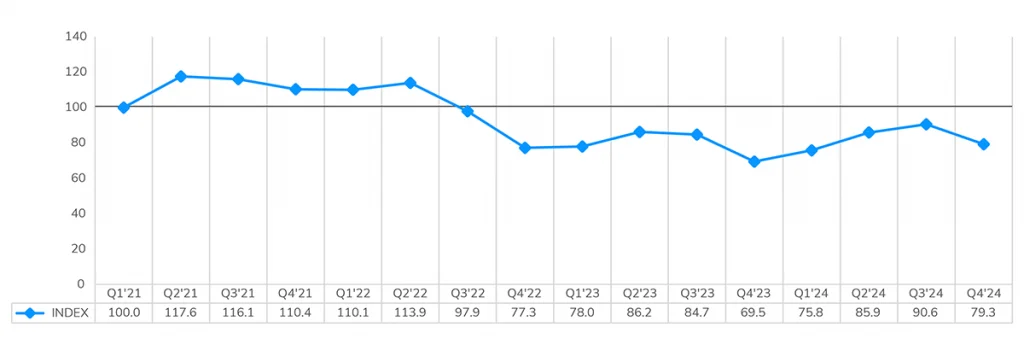
- The LightBox Phase I ESA Activity Index broke its three-quarter streak of increases, falling to 79.4 from Q3’s 90.6, but still above 69.5 one year earlier.
- U.S. Phase I ESA volume decreased to 54,286, a 15% drop from strong Q3 volumes, ending the year 9% above Q4’23’s low point.
- In Q4, the Fed lowered rates two more times after the September 50-basis point cut, totaling 100 bps cuts for the year.
- Atlanta, Las Vegas, and Dallas led the metros with the strongest growth in Phase I ESA volume in 2024 with volume that was 14%, 12%, and 11% above 2023, respectively.
- Despite the quarterly slowdown, due to a mix of seasonal and market factors, the sentiment of the Market Advisory Council remains largely positive and forecasts moderate growth in 2025.
LightBox Phase I ESA Index Ends Year Nearly 10 Points Above Q4 2023 Despite Seasonal Slowness
After three quarters of consecutive growth and the strongest Q3 in two years, the LightBox Phase I ESA Activity Index declined 11.3 points in Q4 to 79.3. The momentum that built up in the market after the Fed’s first rate cut in mid-September waned amid election uncertainty and the typical slowdown around the holiday season. Year over year, the Index is nearly 10 points above where it was at year-end 2023 when property transactions were struggling amid still-high rates and a wide bid-ask gap between buyers and sellers. Over the past four years, the Q4-to-Q1 movement in the Index is typically moderate as the market transitions into the new year and then accelerates in the second quarter. With a mix of tailwinds in the form of growing momentum by investors and lenders and headwinds related to the uncertainty of interest rates, developing federal policies, and the threat of inflation, 2025 may well be anything by typical.
LightBox Phase I ESA Activity Index (base Q1 2021=100)
Market Advisory Council Predicts Flat to Moderate Near-Term Growth, More Bullish For 2025
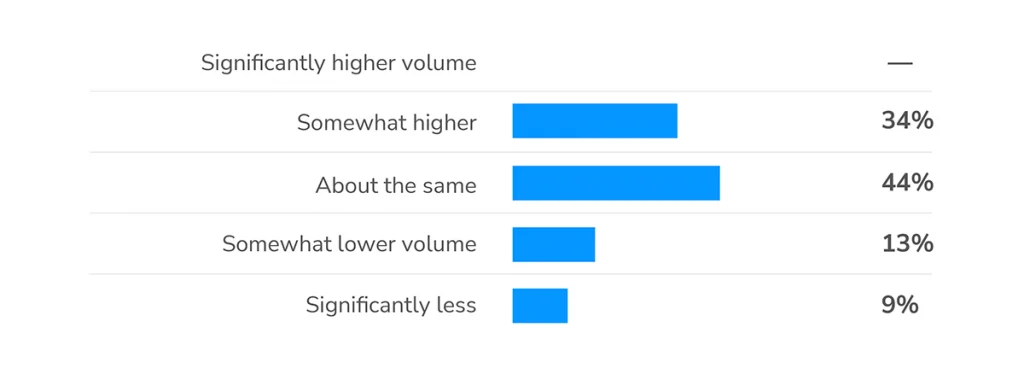
The slower-than-expected Q4 volume, combined with the new wave of uncertainty related to inflationary concerns and the unknown path of interest rates, are tempering the near-term outlook. The Market Advisory Council is predicting stable to moderately increasing Phase I ESA demand in Q1 2025 compared to Q4. Environmental consultants will be supporting any CRE dealmaking activity as willing investors deploy capital and the loosening of debt-side purse strings continues as banks reinvigorate lending for the first time in years.
In contrast with the previous quarterly survey when no council members were expecting a quarter-over-quarter decline, several council members are expecting that Q1 volume could fall below Q4 levels.
“CRE transactions are becoming more attractive to investors as costs are coming down and sellers are showing signs of being more realistic about asking prices. It will be interesting to watch interest rate trends heading into 2025 and how that will impact the cautious optimism.”
– Ben Bremer, President, LCS
Expectations for Phase I ESA Demand in Q1 2025
For full insights into the latest trends shaping the environmental due diligence sector and what’s ahead for Phase I ESA activity in 2025, read the full report.
The LightBox CRE Market Snapshot Series, Q4 2024 – Focus on Phase I ESA Trends contains more detailed information and metrics on trends in Phase I ESA volume by year, quarter region, metro and for the LightBox25 Index.
For more information about this report series or the data, email Insights@LightboxRE.com.